Prof. Jason P. Evans
Climate Change Research Centre
University of New South Wales


Model resolution impact on regional climate and climate change using WRF over south-east Australia.
Evans, J.P. and M.F. McCabe
Climate Research, 56, 131-145, doi: 10.3354/cr01151, 2013. Abstract
Dynamically downscaling climate projections from global climate models (GCMs) for use in impacts and adaptation research has become a common practise in recent years. In this study, the CSIRO Mk3.5 GCM is downscaled using the Weather Research and Forecasting (WRF) regional climate model (RCM) to medium (50km) and high (10km) resolution over south-east Australia. The influence of model resolution on the present-day (1985-2009) modelled regional climate and projected future (2075-2099) changes are examined for both mean climate and extreme precipitation characteristics. Increasing model resolution tended to improve the simulation of present day climate, with larger improvements in areas affected by mountains and coastlines. Examination of circumstances under which increasing the resolution decreased
performance, revealed an error in the GCM circulation, the effects of which had been masked by the GCMs coarse topography. Resolution modifications to projected changes were largest in regions with strong topographic and coastline influences, and can be large enough to change the sign of the climate change projected by the GCM. Known physical mechanisms for these changes included orographic uplift and low-level blocking of air-masses caused by mountains. In terms of precipitation extremes, the GCM projects increases in extremes even when the projected change in the mean was a decrease: but this was not always true for the higher resolution models. Thus, while the higher resolution RCM climate projections often concur with the GCM projections, there are times and places where they differ significantly
due to their better representation of physical processes. It should also be noted that the model resolution can modify precipitation characteristics beyond just its mean value.
Key Figure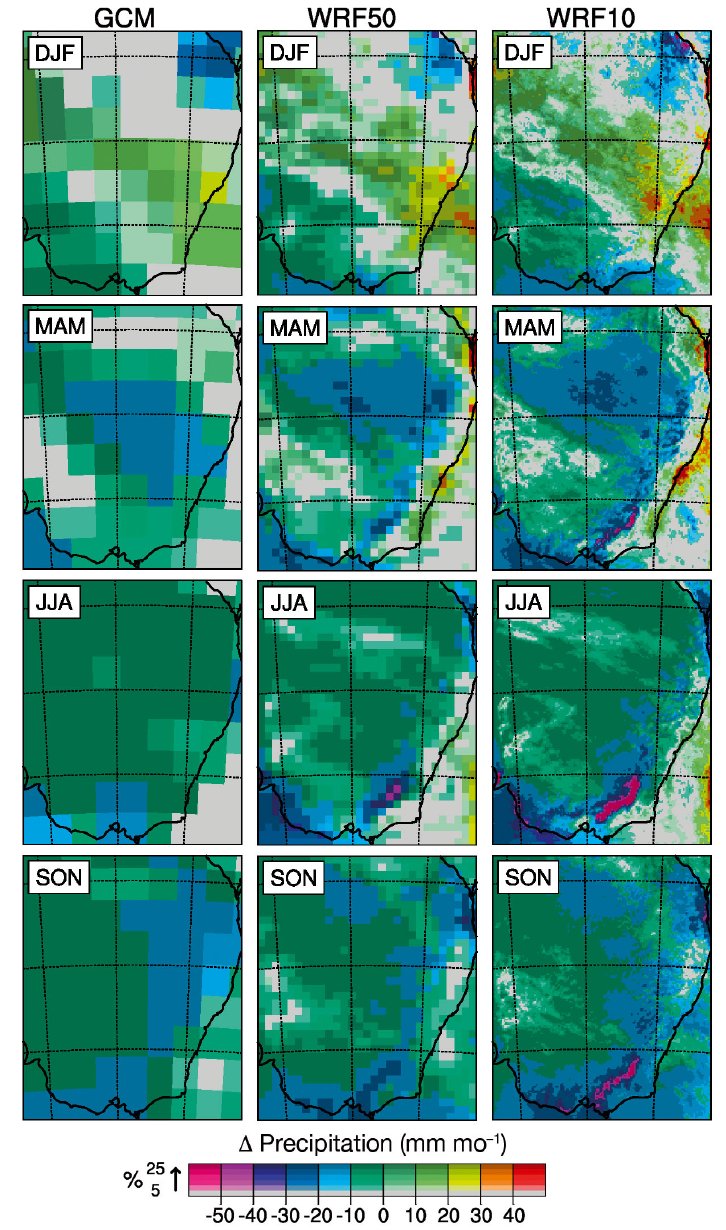 Figure 8: Spatial change in seasonal precipitation. Each panel: 2075–2099 mean minus 1985–2009 mean. Hue: change in mm/month ; saturation: change in % from grey (< 5% change with respect to 1985–2009 mean value regardless of absolute volume of change) to darkest hues (> 25% change) |
|