Prof. Jason P. Evans
Climate Change Research Centre
University of New South Wales


Introducing NARCliM1.5: Evaluation and projection of climate extremes for southeast Australia.
Ji F., N. Nishant, J.P. Evans, G. Di Virgilio, K.K.W. Cheung, E. Tam, K. Beyer, M.L. Riley
Weather and Climate Extremes, 38: 100526. https://doi.org/10.1016/j.wace.2022.100526, 2022. Abstract
NARCliM1.5 is the second generation of New South Wales and Australian Regional Climate Modelling (NARCliM)
project, which is designed to produce an ensemble of regional climate projections for CORDEX Australasia and
southeast Australia. The selected global climate models (GCMs) are used to drive Weather Research and Fore
casting (WRF) model for dynamical downscaling. In this study, we evaluate how well the two generations of
NARCliM (N1.0 and N1.5) represent the observed record for 12 selected climate extremes and examine their
projected changes for southeast Australia. N1.5 ensemble substantially improves upon N1.0 in capturing the
spatial patterns of precipitation extremes, however, there is little difference between the two ensembles for
temperature extremes. Both N1.0 and N1.5 underestimate dry extreme (consecutive dry day - CDD), hot extremes
(warmest daily maximum temperature – TXx, and number of days when maximum temperature is greater than
35 ◦ C - TXge35) and daily temperature range (DTR) but overestimate wet extremes (annual sum of daily pre
cipitation above 99th percentile - R99p, consecutive wet days - CWD, days when precipitation is at least 10 mm -
R10mm, maximum 1-day precipitation - Rx1Day and total wet day precipitation -PRCPTOT) and cold extreme
(coldest daily minimum temperature - TNn). N1.0 and N1.5 project different spatial patterns of future changes in
precipitation extremes but similar changes in temperature extremes. Differences in climate extremes between
N1.0 and N1.5 could be attributed to the driving GCMs. The combined future projections of both N1.0 and N1.5
provide a more complete sampling of the future change space. Future projections indicate that precipitation and
temperature extremes will become more intense, raising implications for future planning and risk management.
Key Figure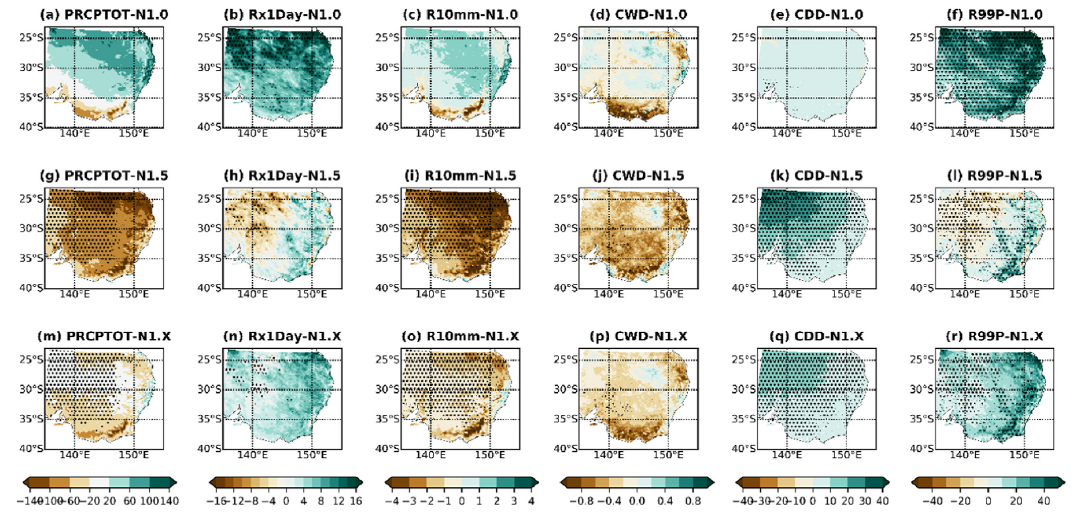 Figure 9. Change in annual climatological mean precipitation extremes between 1990─2009 and 2060─2079. Future time periods are based on the SRESA2 and RCP8.5 emission scenarios for N1.0 and N1.5, respectively. The N1.0 ensemble mean change (top panel a–f), N1.5 ensemble mean change (central panel g–i), and N1. x ensemble mean change (bottom panel m–r). Stippling indicates statistically significant change using a student’s t-test at the 95% confidence level. |
|